")


")
SPSS
Part A:
- Briefly state the Null Hypothesis (Ho). (2 points)
The null hypothesis is that there will be no difference in cat friendliness among the groups (µ1= µ2=µ3).
- Briefly state the Alternative Hypothesis (Ha). (2 points)
The alternative hypothesis is that there will be difference in cat friendliness among the groups.
- What is (are) the Independent Variable(s) and the levels of the IV? (2 points)
The independent variable is the age of first handling, with three levels (3rd week, 7th week, control – no handling)
- What is (are) the Dependent Variable(s)? (2 points)
The dependent variables are how long the cat stays with the experimenter and how quickly it comes to the experimenter, they can also be looked as a single variable – friendliness.
- Describe the possible confound(s) in this experimental design. (10 points)
The first group is handled for longer in total (3rd to 14th week – 11 weeks), relative to the second group (7th to 14th week – 7 weeks), so the possible cause of the effect may not be first time of handling but the length of handling.
- Describe some suggestions for improving the study’s design. (4 points)
Another group should be added – one that would be handled from the 3rd untill the 7th week – that way, if the friendliness of the new group and the first group was the same – we could say that beginning of handling has an effect. Also, if the first group remained the most friendly one and this new group came as second, we could still say that the effect of handling beginning has an effect, and one stronger than recency of handling. On the other hand, if the second group had a higher score, then we could say that recency is more important than beginning.
Part B:
Results and Discussion
A paired-samples t-test was conducted to compare the attractivness ratings in the Interaction and the No interaction group. There was not a significant difference between the Interaction (M = 5.57, SD = 1.39) and the No interaction (M = 4.43, SD = 1.51) groups; t(6) = 1.429, p = .203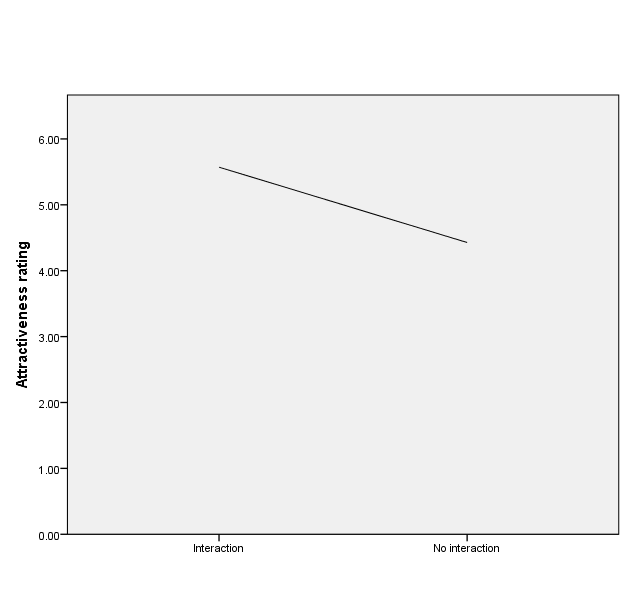 Figure 1: Relationship between groups and attractiveness rating.
The results obtained suggest that there is no effect of interacting with a person on rating him/her as attractive. Such results do not support the physical reinforcement theory. These results may be explained either by wrongness of the theory or by some problems with the research. The most obvious problem is a very small sample. Each person (of whom there were only seven) rated only 2 people. This could be fixed both by using a bigger sample and having the subjects rate more people, using the group averages as measurements.
Task C:
Results and Discussion
A one-way between subjects ANOVA was conducted to compare the effect of time pressure on manufacturing speed in low time pressure, medium time pressure, high time pressure and control conditions. There was a significant effect of time pressure on manufacturing speed at the p<.01 level for the four conditions [F(3, 76) = 14.61, p = 0.00]. A planned apriori test between the three experimental groups against the control group was conducted (contrast coefficients: -1, -1, -1, 3). There was a significant effect of time pressure on car manufacturing speed [t(40) = -4.20, p = .000]. Another planned apriori test was conducted to see if there is a difference between the 50 minute and the 40 minute group(constrast coefficients: -1, +1, 0, 0). There was a significant effect [t(76) = 3.318, p = .001].
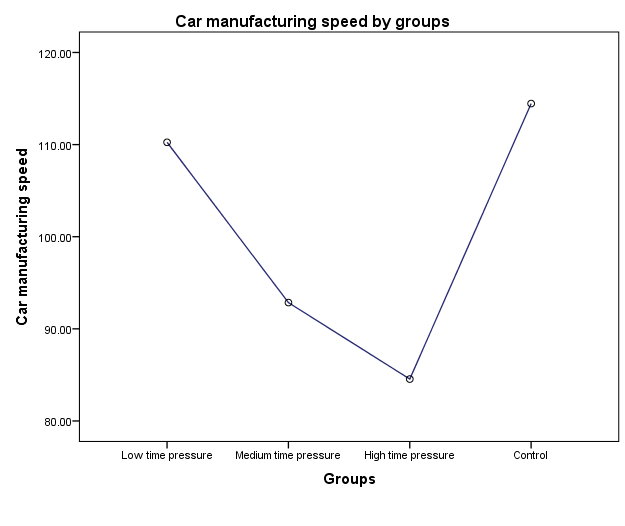 Figure 1: Relationship between groups and car manufaturing speed.
Because of the statistically significant results, post-hoc tests were conducted. Post-hoc comparison using the LSD test showed that the low time pressure group (M = 110.25, SD = 13.86) differed, as already seen from the contrast test, from the medium time pressure group (M = 92.85, SD = 17.96) and the high time pressure group (M = 84.55, SD = 18.55), but did not differ from the control group (M = 114.45, SD = 15.52). The medium and the high time pressure groups differed from the control group, but not within themselves. The relationships can be observed on figure 1.
The results show a clear advantage of the theory which anticipated workers to have reduced productivity under time pressure. This is clear both from the apriori contrast test, which show that there is a general effect of time pressure on productivity and from the post-hoc tests which show that greater time pressure is connected with lower manufacturing speeds. Since the post-hoc tests showed no difference between the low-pressure and the control group, we could presume that there is a threshold which has to be passed in order for time pressure to either take place (meaning that the 50 minute mark isn’t really pressuring) or to have an effect on manufacturing speed (meaning that the 50 minute mark is pressuring, but not strongly enough for an effect to take place). Also, the 30 minute restriction isn’t more pressuring than the 40 minute restriction, which could either mean that the two don’t differ and that a higher pressure (20 minutes, for example) would bring the productivity down even more or that when a threshold is broken, all stronger pressures have the same effect.
Part D:
Results and Discussion
A repeated measures ANOVA was conducted to compare the effects of low drug dosage, moderate drug dosage and high drug dosage on reading comperhension. There was a significant drug dosage effect on reading comperhension at the p<.01 level for the three conditions [F(2, 22) = 50.25, p = .00]. Drug dosage accounted for 82% of variance in reading comperhension scores. Based on Figure 1, we can see that the best results in comperhension scores are achieved when using a moderate dose of drugs (M = 63, SD = 13.75), in contrast with using either a low dose (M = 33, SD = 10.27) or a high dose (M = 34, SD = 11.04).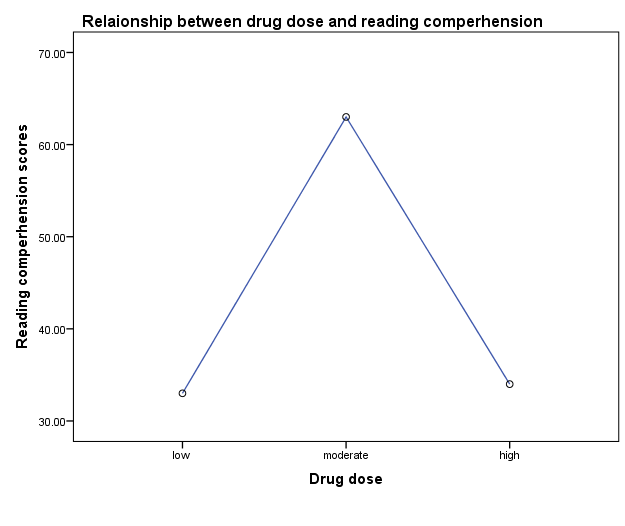 Figure 1: Relationship between drug dose and reading comperhension
These results indicate that reading comperhension is best when using a moderate ammount of drugs. There does not seem to be a difference between high and low drug doses. However, this effect may be confounded by the order in which the drugs were administered. Since the order of dosages was always low on the first day, then moderate on the second day and then high on the third day, it may be possible that the positive effect of the moderate dosage is a cumulative effect of a low and a moderate dosage The drop on the third day may be due to a cumulative overdosage of the drug. This problem can be fixed by using a counter-balancing method, such as randomization or latin square. Another similar issue is derived from the fact that the half-life of the drug wasn’t known. In order to prevent the potential confounding effect of this, the administrations should’ve been more spread out and not following eachother by only a day. Furthermore, the study didn’t obtain a reference point – we don’t know whether the low/high dosage has a positive effect on reading comperhension, because we don’t know how good the comperhension would be without any drugs. These measures should’ve been obtained before any drug administration. Perhaps the biggest issue with the research is that it wasn’t conducted on persons actually diagnostified with ADHD. The findings may simply be an effect of the drug being good for concentration in normal population, but of no use for people with ADHD.
INSTANT PRICE
Get an Instant Price. No Signup Required
We respect your privacy and confidentiality!
Share the excitement and
get a 15% discount
Introduce your friends to The Uni Tutor and get rewarded when they order!